Europe—Two-speed recovery highlights shifting economic fortunes
European Union (EU) economic growth is poised to accelerate to 1.1% in 2024 and 1.8% in 2025 from 0.6% in 2023, according to the IMF. The better outlook reflects easing inflation, growing wages and expectations of falling interest rates which will support household budgets and private consumption. The potential for lower interest rates and additional spending of the EU’s pandemic-recovery budget should boost investment.
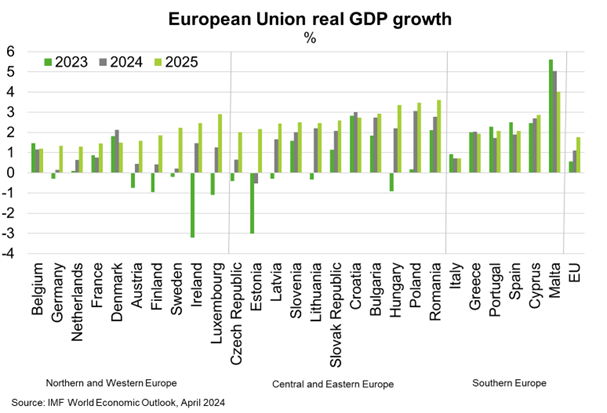
Within this outlook, there are diverging trends (Chart). Germany’s economy, the traditional powerhouse of Europe, is likely to avoid a second straight year of recession in 2024, though only narrowly. Germany is struggling with ongoing high energy prices since Russia’s invasion of Ukraine, fiscal belt tightening and lower Chinese demand for German wares. The latter in part reflects Chinese policies to replace imports with domestic production, a trend that is likely to continue as Beijing increasingly focuses on developing its own high-tech manufacturing and clean energy industries. A recent Constitutional Court ruling that restricts €60 billion (1.4% of GDP) in budget spending further challenges Germany’s outlook. Austria, Belgium, France and the Netherlands are likely to fare better, though a loss in labour cost competitiveness due to fast wage growth in the past few years challenges businesses in these countries.
By contrast, Southern European countries such as Portugal, Italy, Greece and Spain—which have often been economic laggards—are outperforming thanks to the ongoing post-pandemic recovery in tourism and broader services and their lower dependence on sluggish export manufacturing. These four economies have added over €200 billion in GDP (inflation-adjusted) since 2017—roughly the size of New Zealand’s economy today—compared to €88 billion in Germany. Central and Eastern European economies have also been outperforming the rest of the EU, a trend that is poised to continue amid growing domestic demand.